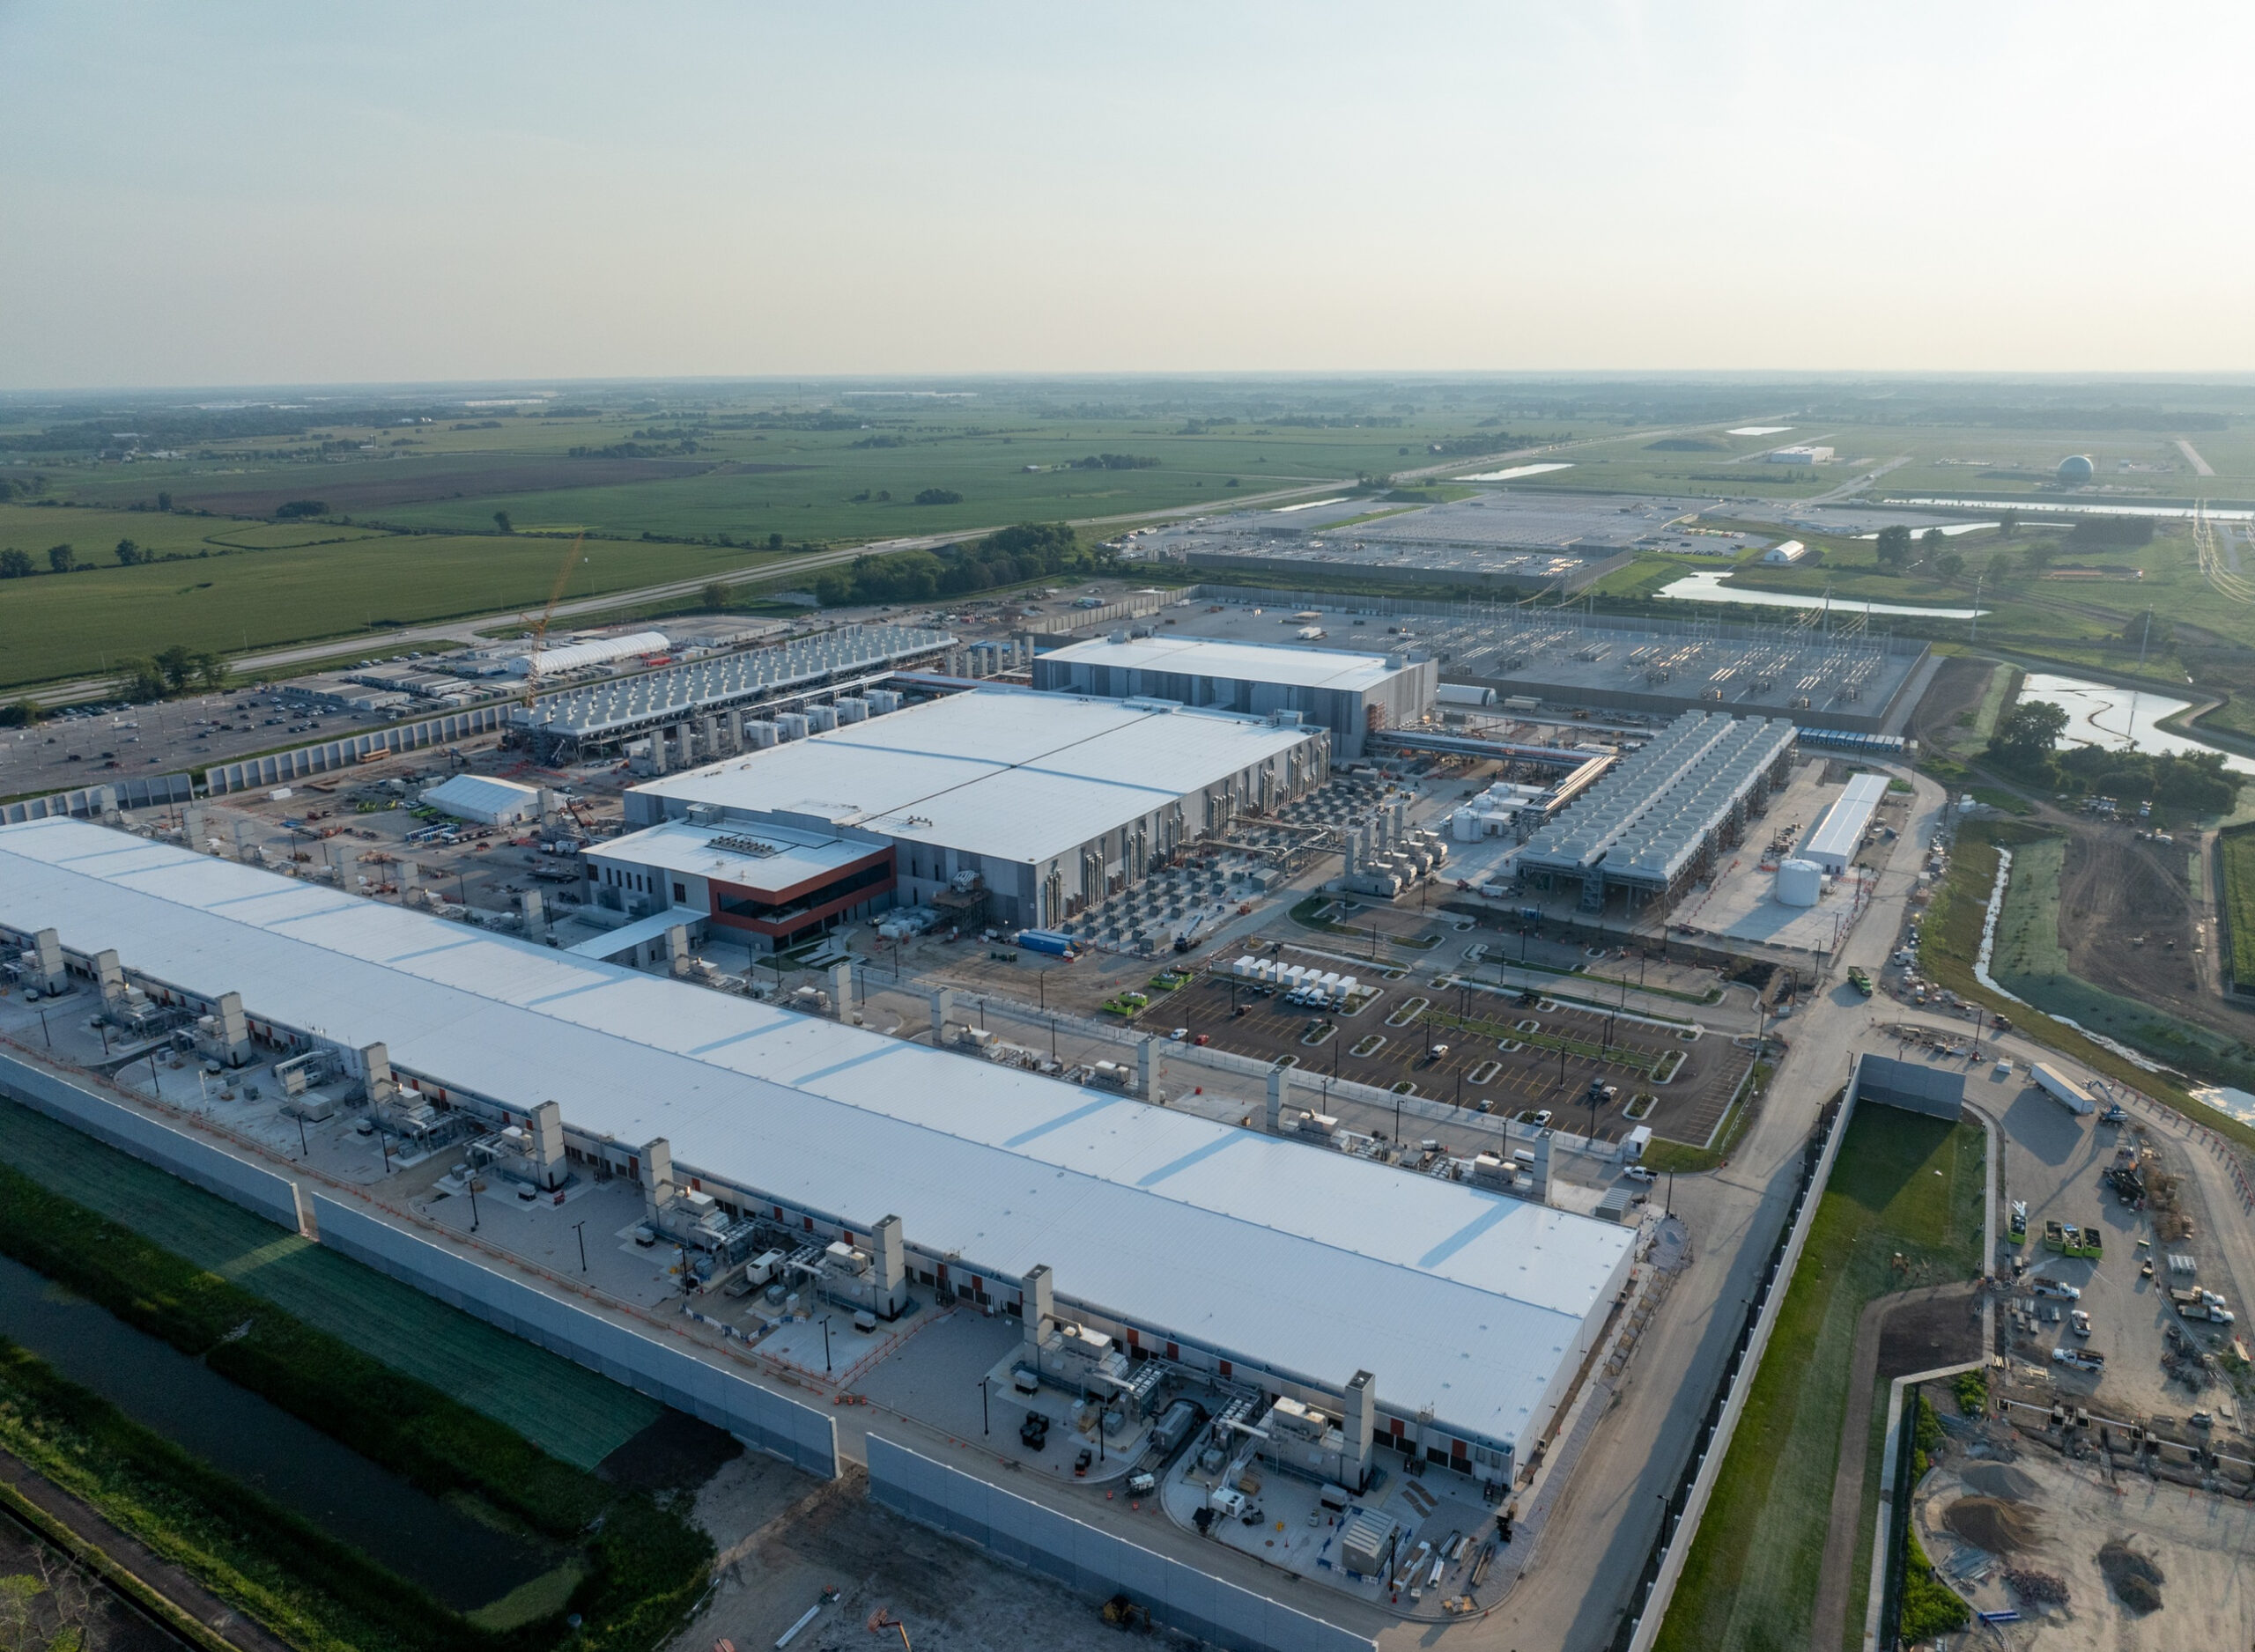
If AI makes you uneasy, start with the power cord.
The software is hard to picture. The buildings it runs in aren’t, and that’s where the real limits are. It’s also the part of AI where ordinary people get a say.
I feel some AI dread, and I’m not alone. Half of American adults told Pew in 2025 they’re more concerned than excited about AI, and another 38% said they feel both. I approach AI the way you’d approach surgery. It’s dangerous and scary, but if you do it right, you can do it very well. And you can’t separate AI’s promise from its perils, any more than a surgeon can heal without cutting. So I don’t think the job is picking a side. We should be doing the best job we can to make it safe for people, and part of that job is making it less mysterious.
So here’s the scale. The International Energy Agency estimates the world’s data centers used about 485 terawatt-hours of electricity in 2025. Its base case has that roughly doubling by 2030, to about 950, slightly more than all of Japan uses today. By the IEA’s numbers, US data centers alone could use about 425 terawatt-hours by 2030, more than half of what every American nuclear plant produces in a year.
Those are the cautious numbers. Most other forecasts I checked come in higher, some much higher.
Follow the Plug
AI runs in buildings, and buildings need electricity. Three ways to see the part of AI you can actually touch: how big it is, how long it takes to power, and how to read the headlines.
How big is it?
How much electricity the world's data centers use, year by year, on the cautious end of public forecasts. Drag the year, or tap a bar.
Show the numbers
Built from public research by the IEA and Lawrence Berkeley National Laboratory. How each number was made is under "How the numbers were built" at the bottom.
Plug it in
Pretend you're building an AI data center today. Pick a size, then pick how you'll get the power.
Yellow squares mark new chip generations. Nvidia says it releases new data center chips on a one-year rhythm, so every year you wait, the hardware you planned around gets a newer sibling.
Run the checklist
Good operators keep a checklist for when things go wrong. Here's a five-item one for AI power headlines. Pick a sample headline and see which questions it answers.
- Cautious on purpose. Where public forecasts disagree, this uses the most cautious mainstream one. Most others run higher (S&P's 451 Research, McKinsey, JLL and Goldman Sachs's public research among them), so read these bars as the cautious case. The IEA's own lower scenarios exist too.
- World. Published IEA figures: 415 TWh (2024), 485 TWh (2025) and about 950 TWh in its 2030 base case. 2019 to 2023 are filled in backward at the 12% a year the IEA reports for the previous five years. 2026 to 2029 are filled in at the steady rate that joins 2025 to 2030, about 14% a year.
- United States. Lawrence Berkeley National Laboratory's estimates of about 76 TWh (2018) and 176 TWh (2023), filled in between at about 18% a year; its low case of 325 TWh for 2028; and about 425 TWh for 2030, calculated from the IEA's US outlook (about 240 TWh added by 2030, a 130% rise on 2024). Years between are filled in at a steady rate. The IEA's own 2024 US estimate, about 185 TWh, sits a little below this path.
- Conversions. Terawatt-hours a year divided by 8.76 gives average gigawatts. A home averages 1.23 kW (10,791 kWh a year, EIA). US nuclear plants produce about 780 TWh a year from 96 reactors, about 0.93 GW each on average (EIA). Rack counts in panel 2 assume every megawatt goes to computers, before cooling.
- Not counted. The IEA's figures leave out crypto mining; 451 Research's include it, which explains most of the gap between them (Our World in Data).
- IEA, Key Questions on Energy and AI (2026): 485 TWh in 2025, about 950 TWh in 2030; and Energy and AI (2025): 415 TWh in 2024, 12% a year over five years, US +240 TWh by 2030; Japan comparison.
- Lawrence Berkeley National Laboratory, 2024 United States Data Center Energy Usage Report: about 76 TWh (2018), 176 TWh (2023), 325 to 580 TWh (2028).
- S&P Global, 451 Research forecast: 1,587 TWh in 2030, low-end case, crypto mining included (11.05.2025). Our World in Data on why the two differ.
- US Energy Information Administration: nuclear share of generation (19%, 2024) and nuclear generation (about 778 billion kWh, 2021); US nuclear fleet (96 reactors, 98,441 MW, March 2026); average home (10,791 kWh a year, 2022).
- Uptime Institute, Global Data Center Survey 2025: average rack density is rising slowly as more racks move into the 10 to 30 kW range; few facilities exceed 30 kW.
- DCD, Schneider Electric and Nvidia reference design: up to 132 kW per liquid-cooled rack (12.06.2024).
- Enverus, Time to Power: grid waits of five to six years in key markets (04.21.2026).
- Modern Power Systems, gas turbine backlog: two to three years, sometimes five or more; slots out to 2030 (02.09.2026).
- World Nuclear News, Crane restart: deal 2024, restart targeted for 2027, first planned for 2028 (06.26.2025).
- Duke Nicholas Institute via Utility Dive: about 76 GW of room for new demand that can throttle back about 85 hours a year (02.11.2025).
- POWER Magazine, transformers: 128-week lead time for power transformers, Q2 2025 (Wood Mackenzie).
- NVIDIA, Computex 2024 keynote: "Our company has a one-year rhythm" (06.02.2024).
- Grid Strategies via Canary Media: utilities may be overstating data center demand by as much as 40% (11.18.2025).
Disclosure: I invest in technology companies and may hold positions, directly or through index funds, in companies mentioned in this piece. This is my personal view, not investment advice, and it does not speak for any company I lead. (Punit Dhillon)
Four words that make the headlines readable
Watt. A watt measures power: how much electricity something draws at a given moment. A kilowatt is a thousand watts, a megawatt a million, a gigawatt a billion. Add hours and you get energy. The average American home uses about 1.2 kilowatts around the clock. Spread over a year, 950 terawatt-hours works out to about 108 gigawatts, the average draw of roughly 88 million homes. A large nuclear reactor puts out about one gigawatt.
Rack. The steel cabinet that holds the computers. Uptime Institute’s 2025 survey found few data centers run racks above 30 kilowatts. A reference design for Nvidia’s big AI rack, built with Schneider Electric, plans for up to 132. At that density, fans can’t move the heat fast enough, so the chips get cooled by liquid piped right to them.
Queue. The line to get plugged into the grid. Analysts at Enverus describe waits of five to six years in the busiest US markets.
Transformer. The gray metal box at a substation that steps high-voltage power down to something a building can use. Wood Mackenzie put the wait for a large power transformer at about 128 weeks in 2025, roughly two and a half years.
Yes, the T in ChatGPT stands for transformer too. Different kind. Everyone talks about the software one. Everyone’s waiting on the metal one.
Fast chips, slow wires
Now put the clocks side by side. Nvidia says it ships new data center chips on a one-year rhythm. A big transformer takes about two and a half years. A grid hookup can take five or six in the busiest markets. The fastest part of AI is waiting on the slowest.
I’ve been part of big capacity build-outs in my industry several times. I’ve watched excess capacity crush the burn rate at companies with no revenue yet. I’ve also watched too little capacity crush demand at a company that had revenue. What I learned is to be surgical about how capacity grows and what it’s for. I think AI’s builders face both risks at once, at a far bigger scale: the IEA says five tech companies now spend more on capital projects than the whole world invests in oil and gas production.
The fair pushback
We’ve heard this before. Between 2010 and 2018, the computing work done in the world’s data centers rose 550% while their electricity use rose 6%, because the machines got far more efficient. That’s still happening. Google says the energy used by its median Gemini text prompt fell 33-fold in one year, to about what a TV uses in nine seconds.
So why worry? Because demand is now growing faster than efficiency can offset. The IEA says electricity use at AI-focused data centers jumped 50% in 2025.
Even the experts can’t agree on the starting line. The IEA puts data center use in 2025 at 485 terawatt-hours; S&P Global’s 451 Research puts it at 860, mostly because one counts crypto mining and the other doesn’t. And US utilities have raised their power demand forecasts three years running, led by data centers. That tells you about momentum, not certainty. Treat any 2030 number as a sketch.
The hopeful part, with numbers
Duke researchers estimated in 2025 that today’s US grid has room for about 76 gigawatts of new demand, if those new users throttle back during the tightest hours, about 85 hours a year. Regulators are moving, too. In June, the Federal Energy Regulatory Commission ordered the six regional grid operators it oversees to justify or fix how they connect large users like data centers.
These are plumbing problems. Slow and expensive, but the kind people know how to fix.
Where you come in
Someone pays for the new wires and power plants. That’s the part that reaches your kitchen table. In September, federal regulators accepted the biggest US grid operator’s backstop plan to buy extra power for data center growth, then put it on hold for five months, partly over who should pay. That argument is probably coming to your state.
Those build-outs taught me one more thing: have a checklist, a protocol for when things go wrong. It’s better to be prepared for the inevitable. Surgery runs on the same idea. In a 2009 study of eight hospitals, deaths after surgery fell from 1.5% to 0.8% once teams started using a World Health Organization checklist. A later rollout across Ontario found no significant drop, which is a fair warning: a checklist only helps if you actually work it. Reading AI headlines is lower stakes, but the habit works the same way. Here’s a five-item checklist for the next one you see:
- Power or energy? Gigawatts measure how much at once. Terawatt-hours measure how much over a year. Headlines mix them up.
- Built or announced? An announced campus isn’t a plugged-in one. Grid Strategies estimates utilities may be overstating data center demand by as much as 40%, partly because the same project gets pitched in several places.
- Where’s the power from? The grid, gas on site, a nuclear deal?
- Who pays for the wires?
- Can it flex? Will it throttle back on the hottest afternoons? That’s its plan for the grid’s worst days.
If you want a say, your state’s utility commission usually takes public comment on questions like these.
The dread doesn’t vanish once you understand the machine. But a machine with a plug is one people can govern.
Follow the plug.
Disclosure: I invest in technology companies and may hold positions, directly or through index funds, in companies mentioned in this piece. This is my personal view, not investment advice, and it does not speak for any company I lead.
Sources
- Pew Research Center, “What the data says about Americans’ views of artificial intelligence,” 03.12.2026.
- International Energy Agency, “Key Questions on Energy and AI,” 2026.
- International Energy Agency, “Energy and AI: Executive summary,” 2025.
- International Energy Agency, “Energy and AI: Energy demand from AI,” 2025.
- Lawrence Berkeley National Laboratory, “2024 United States Data Center Energy Usage Report,” 12.2024.
- US Energy Information Administration, “Five countries account for 71% of the world’s nuclear generation capacity,” 2025.
- US Energy Information Administration, “Nuclear power plants.“
- US Energy Information Administration, “How much electricity does an American home use?“
- Uptime Institute, “Global Data Center Survey 2025,” 07.29.2025.
- DCD, “Schneider Electric co-develops GB200 NVL72 reference architecture with Nvidia,” 12.06.2024.
- Enverus, “Time to Power: Fast-Track Data Center Energization,” 04.21.2026.
- POWER, “Transformers in 2026: Shortage, Scramble, or Self-Inflicted Crisis?,” 2026.
- NVIDIA, “‘Accelerate Everything,’ NVIDIA CEO Says Ahead of COMPUTEX,” 06.02.2024.
- Wikipedia, “Generative pre-trained transformer.“
- Masanet et al., Science, “Recalibrating global data center energy-use estimates,” 2020.
- Google Cloud, “Measuring the environmental impact of AI inference,” 08.21.2025.
- S&P Global, “Global data center power demand expected to almost double by 2030,” 11.05.2025.
- Our World in Data, “How much energy do data centers and artificial intelligence use?“
- Grid Strategies, “Power Demand Forecasts Revised Up for Third Year Running, Led by Data Centers,” 2025.
- Canary Media, “Data-center power forecasts climb to unreachable heights,” 11.18.2025.
- Utility Dive, “Existing US grid can handle ‘significant’ new flexible load: report,” 02.11.2025.
- Morgan Lewis, “FERC Presses Grid Operators on Data Center, Large Load Interconnections,” 07.2026.
- Microgrid Media, “FERC Suspends PJM’s Backstop Procurement Five Months and PJM Pulls Its September 30 Auction,” 09.29.2026.
- Haynes et al., New England Journal of Medicine, “A Surgical Safety Checklist to Reduce Morbidity and Mortality in a Global Population,” 01.14.2009.
- Urbach et al., New England Journal of Medicine, “Introduction of Surgical Safety Checklists in Ontario, Canada,” 03.13.2014.
Cover: Microsoft’s Fairwater AI data center under construction in Mount Pleasant, Wisconsin. Photo taken August 7, 2025. © Southport Images / stock.adobe.com, cropped.